
More than 200 colored circles freckle the coastline of Long Island Sound on a digital map. Peter Linderoth, director of water quality for Save the Sound, calls them “Skittles,” but instead of candy flavors, this colorful assortment represents grades.
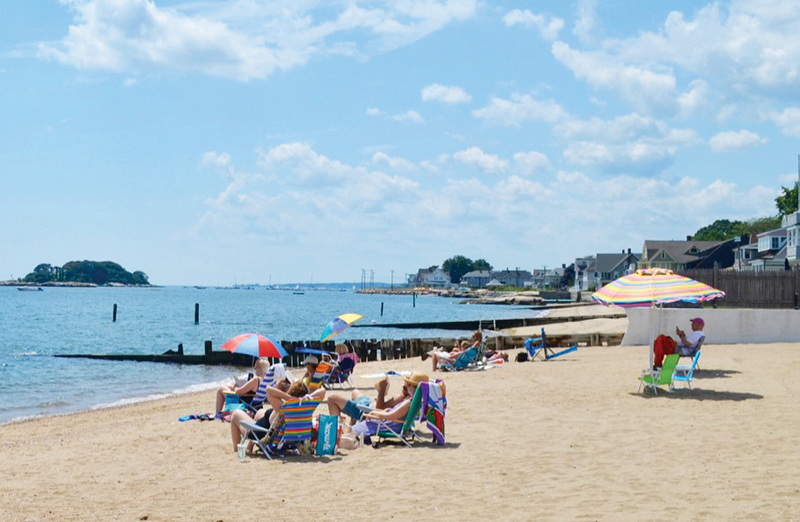
This user-friendly data visualization is essential to the effectiveness of the Long Island Sound Beach Report, an assessment of beach water quality issued biennially by Save the Sound (next due later this month). Intuitive maps—green is good, red needs improvement—help the public access information about the water at the beaches we swim in every summer.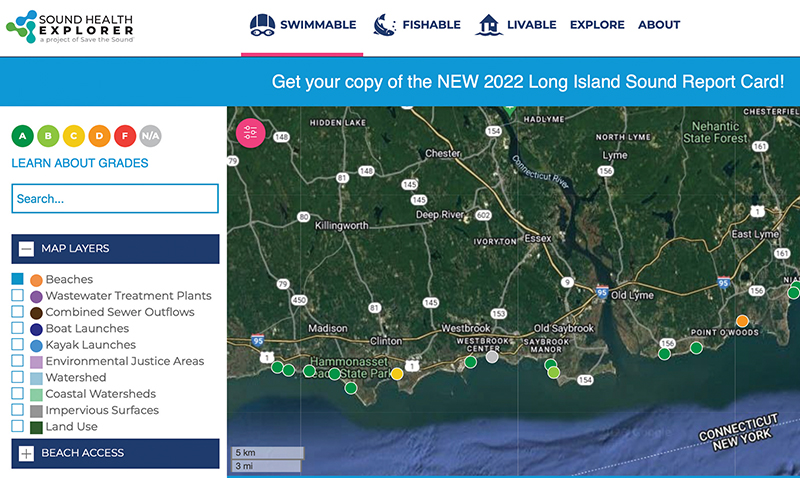
“There’s a vault of public data from local health departments around the sound, largely paid for by taxpayers,” said Linderoth. “And other than beach managers, most people don’t even know it exists.”
He’s talking about the EPA’s Water Quality Exchange, which aggregates the data that fuels the Beach Report. Water samples are collected and analyzed, measuring fecal bacteria concentrations against state criteria for safe swimming and factoring in rainfall totals. Users don’t have to dive into the data themselves to understand a beach’s water quality over the years; they can visit www.soundhealthexplorer.org/swimmable, the interactive version of the Beach Report, to see whether their intended destination’s “Skittles” tend to be red, green, or in-between.
Take White Sands Beach in Old Lyme, near the mouth of the Connecticut River. In the 2021 report, which reflected data collected from 2018 to 2020, White Sands ranked as one of the top 10 public beaches in Connecticut, receiving an A+—the brightest green rating achievable.
That’s nothing new. The last time a water sample from White Sands failed to meet the criteria for safe levels of Enterococci bacteria was September 7, 2011—10 days after Tropical Storm Irene crashed into the Connecticut coast. The 153 samples collected at White Sands Beach since have received passing grades, and the beach has earned a string of A+ grades.
Images courtesy of Save the Sound
Most beaches are not as consistent. For example, Town Beach in Old Saybrook, just across the Connecticut River to the west, received grades ranging from C+ to A+ between 2016 and 2021.
“Each beach faces its own local challenges to water quality,” said Linderoth, citing outdated sanitary sewage infrastructure or inadequate septic systems, high percentages of impervious surface, direct stormwater runoff, and waste from pets or wildlife.
The Beach Report doesn’t replace local beach management, and it’s not used to determine whether a beach is open or closed on a given day. Instead, think of it as a colorful conversation starter—a way to alert local officials to a potential problem so the important work of resolving it can begin and communities can safely enjoy more days at their favorite beach.
For more than 50 years, Save the Sound has been protecting Long Island Sound and its rivers, fighting climate change, saving endangered lands, and working with nature to restore ecosystems. It uses a holistic toolbox to ensure people and wildlife across the whole sound region can enjoy the healthy, clean, and thriving environment they deserve. Learn more at www.savethesound.org.
David Seigerman is clean water communications specialist for Save the Sound.